
Key Takeaways
- Standard equity-style attribution models, including Brinson-Fachler, can be difficult to interpret for bond portfolios because they do not separately isolate interest rate, yield curve, and spread effects.
- Purpose-built fixed income attribution models like Campisi, van Breukelen, and factor-based approaches offer different modeled explanations of returns based on their assumptions, available data, and methodology.
- Isolating carry and roll-down effects can make bond performance discussions more precise, especially in volatile rate environments where income, curve shape, and price effects interact.
- The reliability of any attribution output depends on data integrity. Inconsistent pricing sources, benchmark construction choices, and proxy mismatches can create analytical noise that is unrelated to portfolio decisions.
- Connecting attribution insights to the broader portfolio review workflow can help firms communicate results more clearly, even when comparative portfolio analysis is conducted independently of specialized attribution systems.
Performance attribution is more common among institutional investment teams and larger wealth management organizations than across the full spectrum of advisory firms. Yet when it comes to bond portfolios, the familiar frameworks used for equity analysis can obscure more than they reveal. A standard fixed income attribution analysis is not simply a direct extension of equity-style models. Bond returns are shaped by a complex interplay of yield curve movements, credit spread changes, income generation, and structural effects like roll-down dynamics that a sector-allocation and security-selection framework was not designed to isolate separately.
This creates a structural mismatch, not a user error. When an equity-centric model is applied to a fixed income portfolio, the resulting output may support a benchmark-relative decomposition, but it may not provide the same explanatory clarity around duration, curve, and spread exposures that a purpose-built fixed income framework is designed to model.
This article provides a practitioner-oriented guide to fixed income return attribution. We will explain where traditional models have interpretive limitations, compare commonly used frameworks, and address the operational realities, data quality, benchmark alignment, and multi-period linking considerations that shape whether attribution outputs are reliable enough to inform investment discussions and client conversations.
Why Brinson-Style Attribution Can Be Hard to Interpret for Bond Portfolios
The Brinson-Fachler model, a cornerstone of equity attribution, decomposes excess returns into two primary modeled attribution effects: allocation and selection. For equities, this framework often aligns closely with how teams discuss sector weights and stock selection.
When applied to fixed income, however, interpretation becomes more complicated. The primary drivers of bond returns often include systematic factors that affect securities with similar characteristics, most notably interest rate sensitivity, curve positioning, and spread movements. A Brinson-style analysis can still provide a benchmark-relative decomposition, but it does not separately isolate those drivers within its allocation and selection framework.
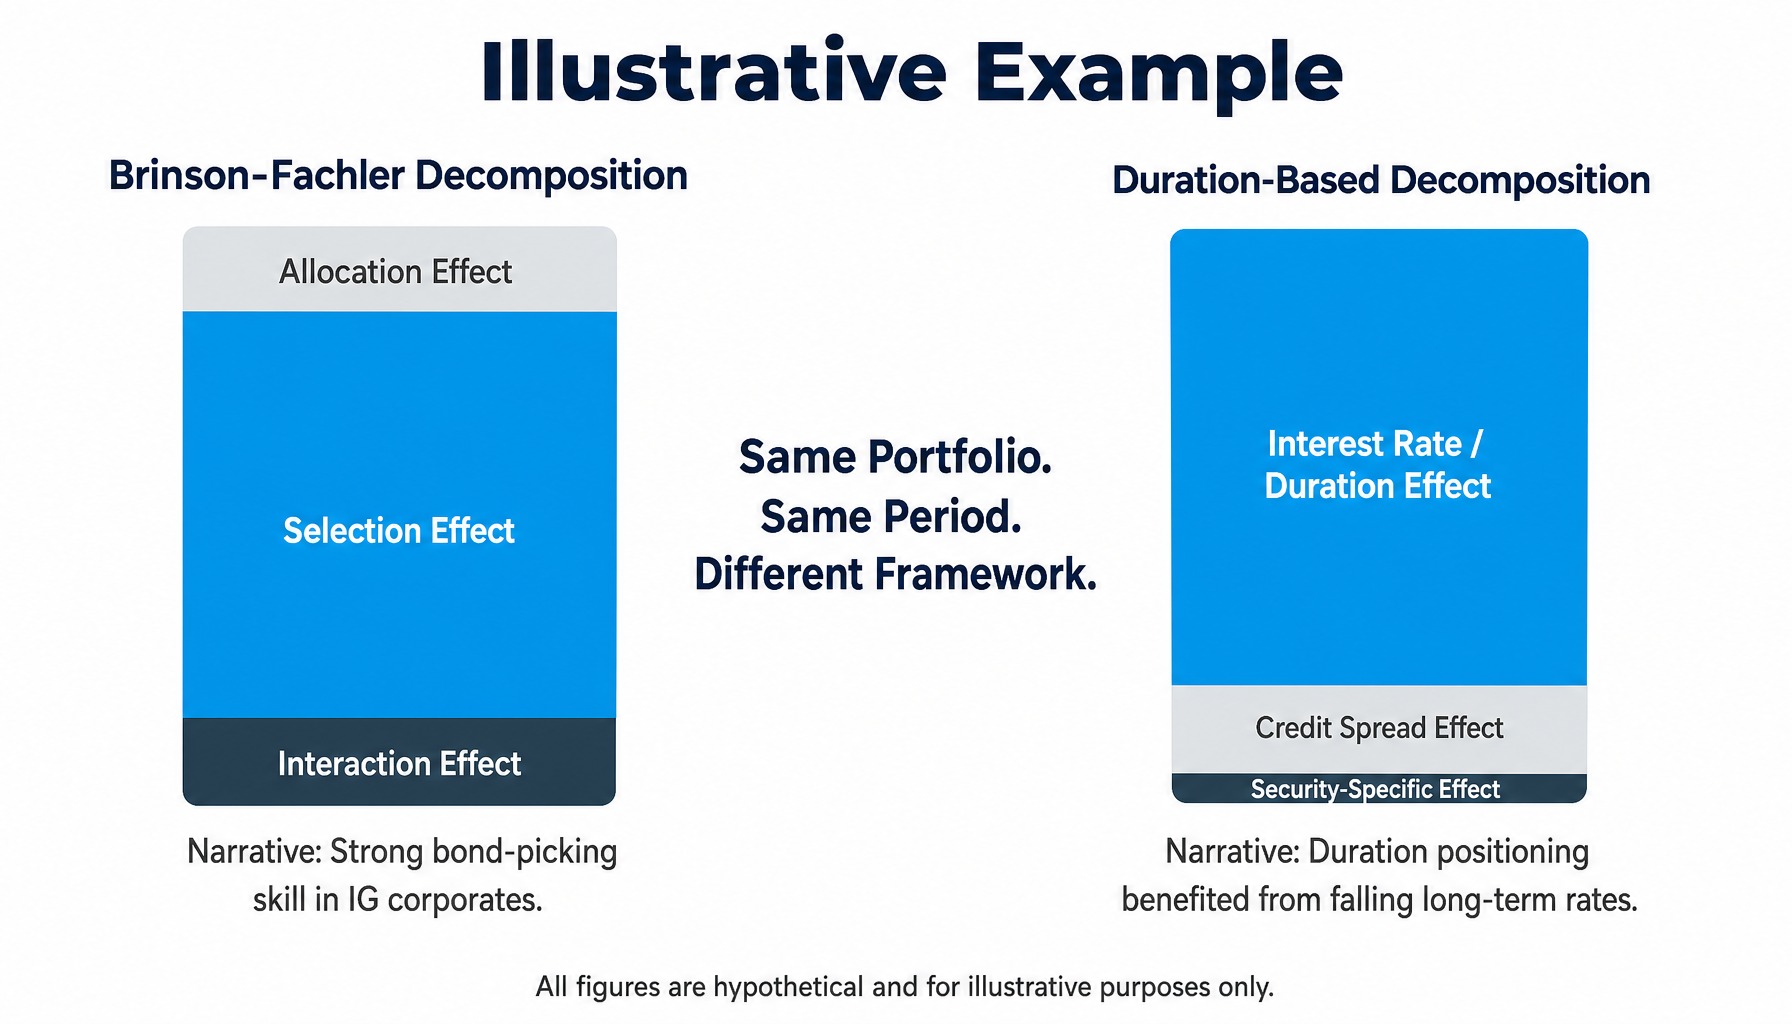
Consider a hypothetical multi-sector bond portfolio that modestly outperformed its benchmark over a quarter where the yield curve flattened.
- A Brinson-Fachler decomposition might show a large, positive selection effect within the investment-grade corporate sleeve. An investment committee could interpret this as evidence of strong relative results within that segment.
- A duration-based decomposition of the same portfolio might tell a different story, showing that much of the relative return reflected the portfolio's longer duration profile versus the benchmark during a move in long-term rates. In that case, the Brinson output is not mathematically wrong, but it is less specific about the interest rate and curve exposures that shaped the result.
In this scenario, the framework choice determines the narrative. The Brinson model produces a benchmark-relative story about allocation and selection, while a more specialized fixed income attribution model may produce a more detailed story about interest rate positioning, curve exposure, and spread effects. Using a framework designed for a different return structure can therefore make bond portfolio results harder to interpret, especially when firms want to explain what drove performance in fixed income terms.
Comparing Fixed Income Attribution Models: Campisi, van Breukelen, and Factor-Based Approaches
Because equity-style models do not always provide the level of explanation firms want for bond portfolios, practitioners use several frameworks for fixed income return attribution. The choice among them depends on a firm's investment process, portfolio complexity, reporting audience, and data resources.
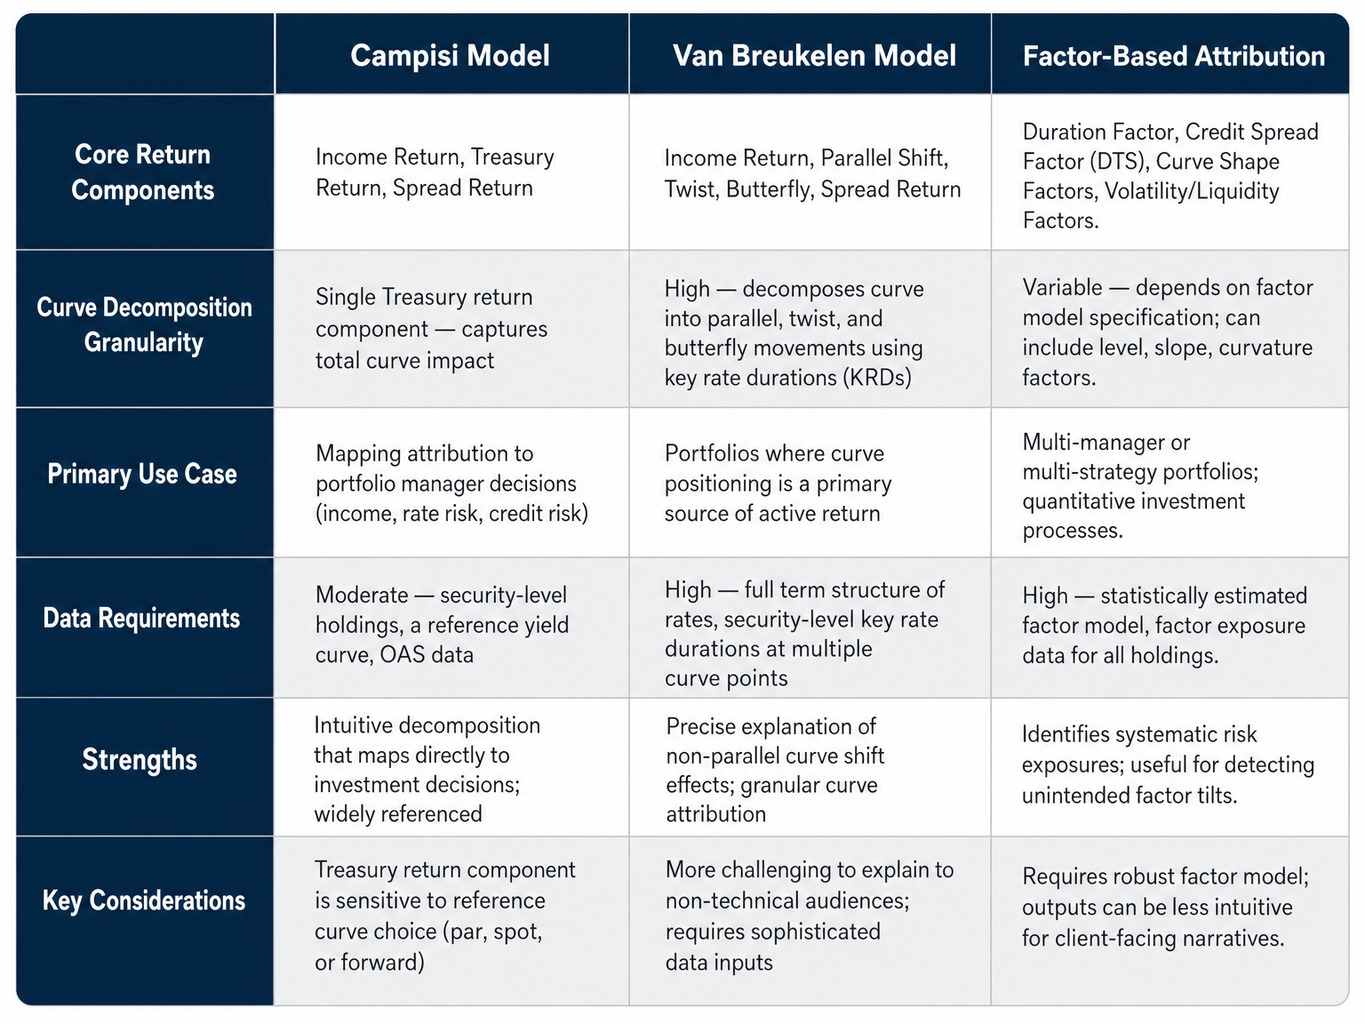
The Campisi model is one of the most widely referenced frameworks, decomposing a bond's total return into three intuitive components:
- Income Return: The yield earned from coupon payments and the amortization of discounts or premiums.
- Treasury Return: The price change resulting from movements in the underlying risk-free yield curve. This is one modeled explanation of how interest rate exposure contributed to results.
- Spread Return: The price change resulting from the widening or tightening of the bond's spread over the risk-free curve.
The strength of the Campisi approach is that it often maps cleanly to how investment teams discuss income, interest rate exposure, and spread exposure. For advisors and wealth management decision-makers, the practical takeaway is less about choosing a single best model and more about understanding that different fixed income attribution models frame bond performance in different ways.
A CIO reviewing quarterly results, for example, may use a Campisi-style framework to assess whether relative performance aligned more closely with rate exposure or spread exposure. While widely used, the Campisi framework's Treasury return component is sensitive to which reference curve is used, since a par, spot, or forward curve can produce different decompositions.
Van Breukelen and Yield Curve Decomposition
For portfolios where curve positioning is a major source of active return, the van Breukelen framework offers more granularity. It decomposes rate-related return into components such as parallel shifts, twists, and butterfly movements.
This added detail is useful in some investment contexts, but it also raises the complexity of the analysis and the communication burden. For many advisory firms, the more important consideration is whether a chosen methodology produces a level of explanation that is clear enough to support internal reviews and client-facing discussions.
Factor-Based Attribution and Systematic Risk Decomposition
A third approach, factor-based attribution, moves away from the traditional taxonomy of sectors and securities. Instead, it decomposes returns based on a portfolio's exposure to systematic risk factors, such as interest rate duration, spread exposure, curve shape, volatility, or liquidity.
This method can be useful for firms evaluating broad risk exposures across complex portfolios, but it also introduces a different interpretive challenge. Because the factors are model-defined, the results may be less intuitive to translate into plain-language portfolio commentary. For wealth management firms, that distinction matters because the operational challenge is not only producing analytical output, but also turning it into a clear and consistent narrative for reviews, proposals, and committee materials.
How Carry and Roll-Down Attribution Clarifies Bond Return Conversations
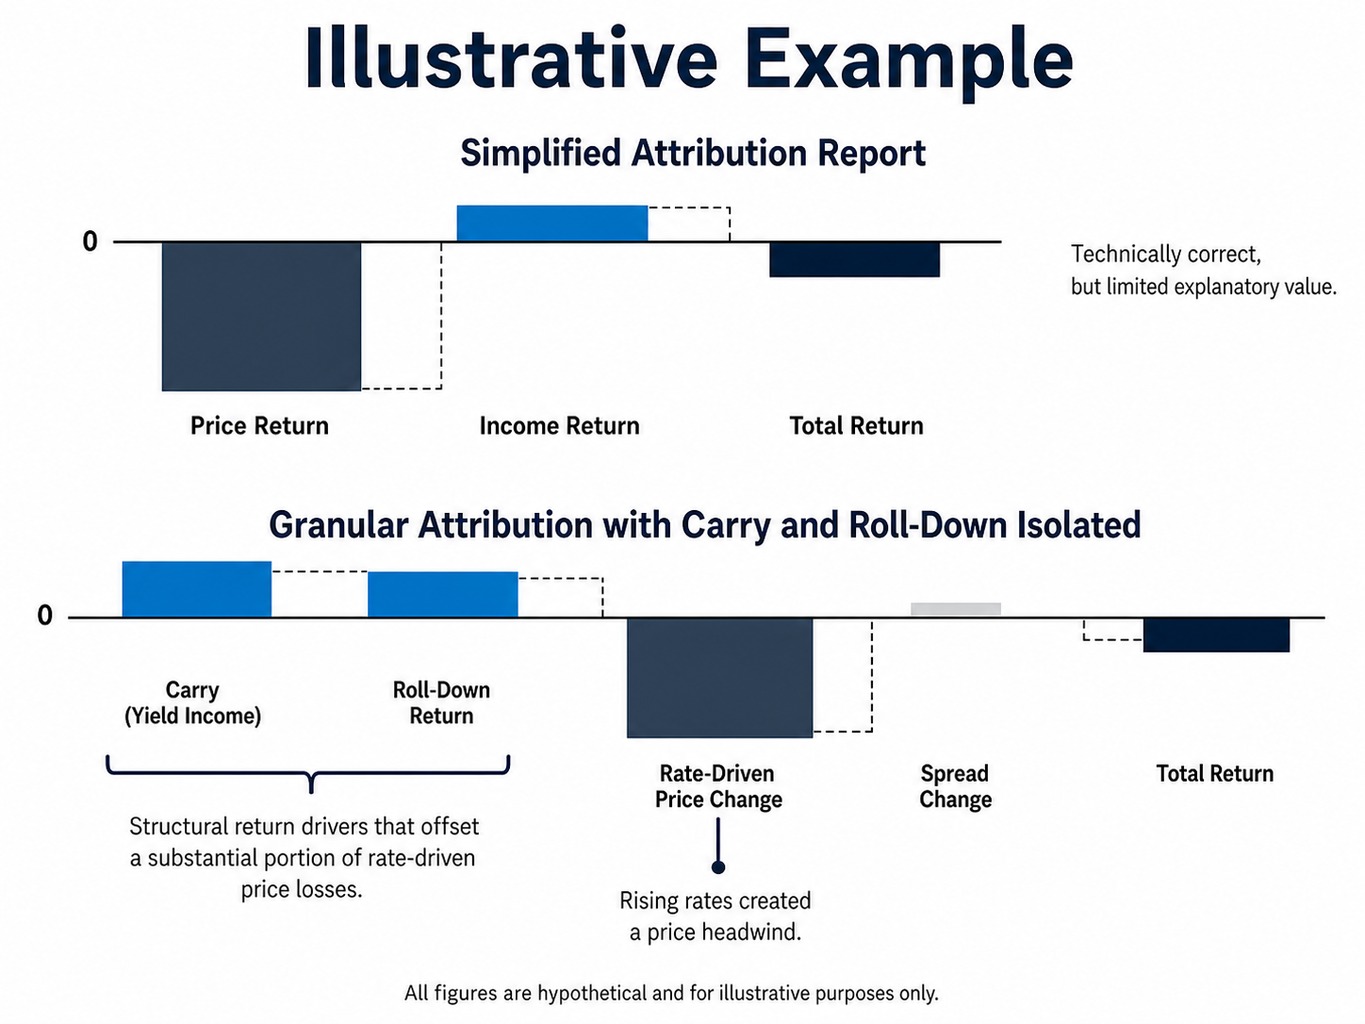
In many periods, carry and roll-down are meaningful contributors to bond returns. Yet in simplified attribution reports, these effects are often grouped into broader income or price categories, which can make the explanation less precise.
- Carry generally refers to the income or expected return from holding a bond over time, as defined within a given strategy or attribution framework.
- Roll-Down refers to the modeled price effect that can occur as a bond ages into a different point on the yield curve, often under an assumption that the curve's shape remains unchanged.
The distinction matters because these components can help firms explain how income, curve shape, and price movements interacted over the period. If an attribution report does not isolate them, the result may still be directionally useful, but it can be less informative about how different forces contributed to the final return.
Consider a hypothetical portfolio of intermediate investment-grade bonds during a quarter of modest rate increases. The portfolio's total return was slightly negative. A simplified attribution report might show only two lines: Price Return: Negative and Income Return: Positive. That summary is not wrong, but it leaves limited room for nuance.
A more granular attribution that isolates carry and roll-down would provide a clearer picture. It might show that while rising rates created a price headwind, carry and roll-down helped offset part of that effect under the model's assumptions. This gives advisors and investment teams a more precise way to describe what happened, without implying that roll-down is guaranteed or that one framework fully captures every source of return.
Data Quality and Benchmark Proxy Mismatch: Where Attribution Outputs Break Down
Even a well-chosen fixed income attribution model can produce unreliable outputs if the underlying data is inconsistent. Small discrepancies can compound into residuals or attribution effects that are difficult to interpret. Two common failure points are pricing source differences and benchmark proxy mismatch.
First, if a firm's portfolio accounting system uses one pricing source while the benchmark data in the attribution process relies on another, the resulting analysis may reflect input inconsistencies rather than portfolio decisions. These pricing discrepancies are often most visible in less liquid segments like municipal bonds or high-yield credit, where evaluated prices can vary meaningfully across vendors. The attribution output may show a persistent residual that teams could mistake for transaction costs or manager drag, when in reality it reflects a data-sourcing issue.
Second, firms often run into benchmark proxy mismatch. Suppose a firm manages a corporate-only bond portfolio but evaluates it against a broad market benchmark like the Bloomberg Aggregate Bond Index, which includes Treasuries, agency mortgage-backed securities (MBS), and other securitized products. The attribution output may show recurring allocation effects tied to sectors the portfolio does not own, but the direction and magnitude of those effects depend on benchmark sector returns and the model being used. Excluding MBS, for example, may be an intentional portfolio construction decision, yet the benchmark can still make the resulting attribution harder to interpret if the comparison set is too broad for the mandate.
Before interpreting any attribution result, firms may want to review pricing consistency, benchmark appropriateness, and reconciliation practices so the narrative rests on comparable inputs rather than avoidable noise.
Read more: Operational Visibility for Wealth Management Growth | VRGL
Multi-Period Linking Challenges Specific to Fixed Income Attribution
While single-period attribution is relatively straightforward, most client and committee reporting requires summarizing performance over quarters, years, or since inception. The methodology used to link, or chain together, single-period results introduces its own set of interpretation challenges.
Many systems default to arithmetic linking by summing daily or monthly attribution effects. This approach is intuitive, but over longer periods it may not fully reflect the compounding path of returns. In volatile markets, that can contribute to residuals or reconciliation differences between linked attribution effects and reported total return.
Methods such as Carino and Menchero are approaches for linking single-period arithmetic attribution effects across multiple periods while accounting for compounding. Even so, the reconciliation outcome still depends on the underlying attribution framework and implementation choices. For fixed income portfolios, the issue becomes more complicated when rebalancing activity is frequent. When a bond matures or is called, the attribution process must handle that discontinuity, which can create attribution noise that varies by methodology. As firms consider performance presentation consistency, including frameworks such as the CFA Institute's Global Investment Performance Standards (GIPS), these details can materially affect how confidently results are interpreted and communicated.
Where Fixed Income Attribution Fits in the Advisory Portfolio Review Workflow
Ultimately, fixed income attribution analysis provides the most value when it connects to the broader portfolio review and client communication workflow, not when it exists as an isolated exercise for the investment team. For advisory firms, attribution insights may inform quarterly review materials, current-versus-proposed portfolio comparisons, and investment committee reporting, even when those downstream workflows are handled in separate systems.
The practical challenge is often operational. An investment team might run a detailed attribution analysis in a specialized system, then manually summarize parts of that analysis for a client-facing presentation. In that translation, nuance can be lost. A more detailed explanation of spread contribution versus Treasury effects may be reduced to a much simpler description of bond performance.
For a scalable firm, the broader goal is a more connected review process where specialized analytics, comparative portfolio analysis, and client-ready reporting each support clearer communication. This allows advisors to speak more precisely about portfolio characteristics, tradeoffs, and positioning in the context of the broader client conversation.
Read more: Wealth Management Proposal Software in 2026: What the Feature List Doesn't Tell You | VRGL
How VRGL Supports the Analytical Workflow Around Fixed Income Portfolio Review
Specialized attribution systems and comparative portfolio analysis platforms serve different purposes. VRGL is a configurable system of work that helps advisory firms standardize how portfolio analysis is prepared, presented, and governed across the client lifecycle. Discovery and fact-finding remain with the advisor. Once portfolio data has been gathered, VRGL helps firms turn that information into structured analysis and client-ready materials.
VRGL does not provide fixed income attribution, and it should not be viewed as dependent on specialized attribution systems to deliver its core analytical workflow.
- Statement Extraction: VRGL can automate the intake of portfolio data from client and prospect statements, creating a structured data set that supports subsequent analysis.
- Comparative Portfolio Analysis: VRGL's analytics help advisors evaluate current and proposed portfolios across performance, risk, diversification, taxes, and fees. This supports clear, objective comparisons whether or not a firm uses a separate fixed income attribution process.
- Client-Ready Presentations: VRGL's own analytical outputs flow into configurable, firm-branded proposal and review templates, helping firms present portfolio comparisons and related insights with greater consistency and clarity.
By connecting data intake, portfolio analytics, and client-ready reporting, VRGL can help firms standardize the work that surrounds portfolio review and make it easier to prepare clear, consistent materials for clients and prospects.
See how VRGL supports your acquisition workflow
Fixed income attribution analysis is not just a reporting exercise. It is one way firms can frame what drove a bond portfolio's performance under a given methodology. Choosing an appropriate model, maintaining data integrity, and handling multi-period linking carefully all shape how useful that explanation will be. But for many wealth management firms, the broader operational challenge is turning complex portfolio information into materials that are clear, consistent, and ready for real conversations. That is where workflow design and comparative portfolio analysis become especially important.
This content is for informational purposes only and should not be considered investment, legal, tax, or compliance advice. All investment decisions should be made based on your own due diligence and in consultation with qualified professionals.
Frequently Asked Questions
What data inputs are needed to run a reliable fixed income attribution analysis?
The data required for fixed income attribution analysis depends on the methodology being used. Many frameworks rely on security-level holdings and market values, while some also use duration, spread, benchmark, curve, or other reference data. The key operational requirement is that the inputs are sufficiently consistent and reconcilable for the chosen model.
How does option-adjusted spread factor into credit attribution for bond portfolios?
OAS adjusts a bond's spread for the modeled value of embedded options, such as call features. In attribution, changes in OAS are often used to help explain spread-related return components, but the remaining spread can still reflect liquidity conditions, risk premiums, and other factors in addition to credit.
Why do residual terms appear in fixed income attribution and how can they be reduced?
Residuals arise from model approximation errors, pricing inconsistencies between the portfolio and benchmark, and multi-period linking artifacts. Firms can often reduce them through better reconciliation practices, more consistent data inputs, and a linking approach that fits the attribution methodology being used.
How do firms typically decide between top-down and bottom-up fixed income attribution?
Top-down approaches start with higher-level portfolio groupings, such as sector or duration buckets, while bottom-up approaches begin at the security level and aggregate upward. The choice usually depends on the audience, reporting objective, and level of detail a firm wants from its fixed income attribution analysis.
What challenges arise when implementing fixed income attribution across a multi-manager platform?
Key challenges include aligning different manager benchmarks, reconciling inconsistent data inputs, and aggregating manager-level attribution into a broader view without creating analytical artifacts. Firms also need to decide whether they want the analysis to emphasize total portfolio results, manager-level detail, or both.